
Reporting automation
Marketing reporting automation and dashboards
Reports that build themselves while you sleep.
Marketing reporting automation replaces the report you rebuild by hand each month with numbers pulled from their sources on a schedule, calculated the same way every time, and shown in one dashboard that refreshes on its own. I agree the KPI definitions with you, connect the data, and build the dashboard in HubSpot, Power BI, Tableau or Excel.
When this helps
Start with the problem, not another tool.
I review the current setup before recommending software, channels, or a larger build.
The monthly report is rebuilt by hand, from scratch
Numbers live in tools that never talk to each other
Two reports answer the same question differently
By the time the data is ready, the decision is late
Ad-platform conversions and CRM leads don't match
Only one person knows how the spreadsheet works
What marketing reporting automation replaces
Most manual reporting is not analysis: it is export, clean, match and paste, every month. Automated marketing reporting takes over those steps, but it cannot decide what a metric means, so that is agreed first. Skipping that step is why marketing reporting still takes so much manual work.
| Manual step today | What replaces it |
|---|---|
| Exporting CSVs from ad platforms, GA4 and the CRM | A native integration, connector or scheduled pull per source |
| Fixing campaign names so rows line up | A UTM naming convention, plus a lookup table for old names |
| Matching leads to campaigns with VLOOKUPs | Source and campaign fields set on the CRM record at creation |
| Rebuilding charts and slides | One dashboard with fixed views, shared by link |
| Explaining why two totals disagree | A KPI definition sheet naming one source per number |
What gets built
Four parts, built in this order: the KPI definitions, the data connections, the dashboard and the monthly scorecard.
KPI definitions with one source for each number
Before anything is connected, we write down what each metric counts, its formula, the system that owns it, and who investigates when it looks wrong. An ad platform's lead and a CRM lead differ; the sheet says which one counts.
| Field | Example: marketing-qualified leads |
|---|---|
| What it counts | Contacts that meet the agreed MQL criteria |
| Formula | Count of contacts whose 'became an MQL' date falls in the reporting period (contacts that skip the MQL stage have no such date and are not counted) |
| Source of truth | CRM lifecycle stage history, not ad-platform conversions |
| Owner | A named person on your team |
Connected sources: ad platforms, GA4, CRM, spreadsheets
Each source connects by the simplest reliable route: native integration, then connector or API, then scheduled import. Where two tools have no direct link, I use Make and Zapier workflow automation to move the data on a schedule.
- Ad platforms: spend, clicks and platform-reported conversions
- GA4: sessions and key events by source, medium and campaign
- CRM: contacts, lifecycle stages, deals and revenue
- Spreadsheets: budgets, targets and offline data
Dashboard implementation in HubSpot, Power BI, Tableau or Excel
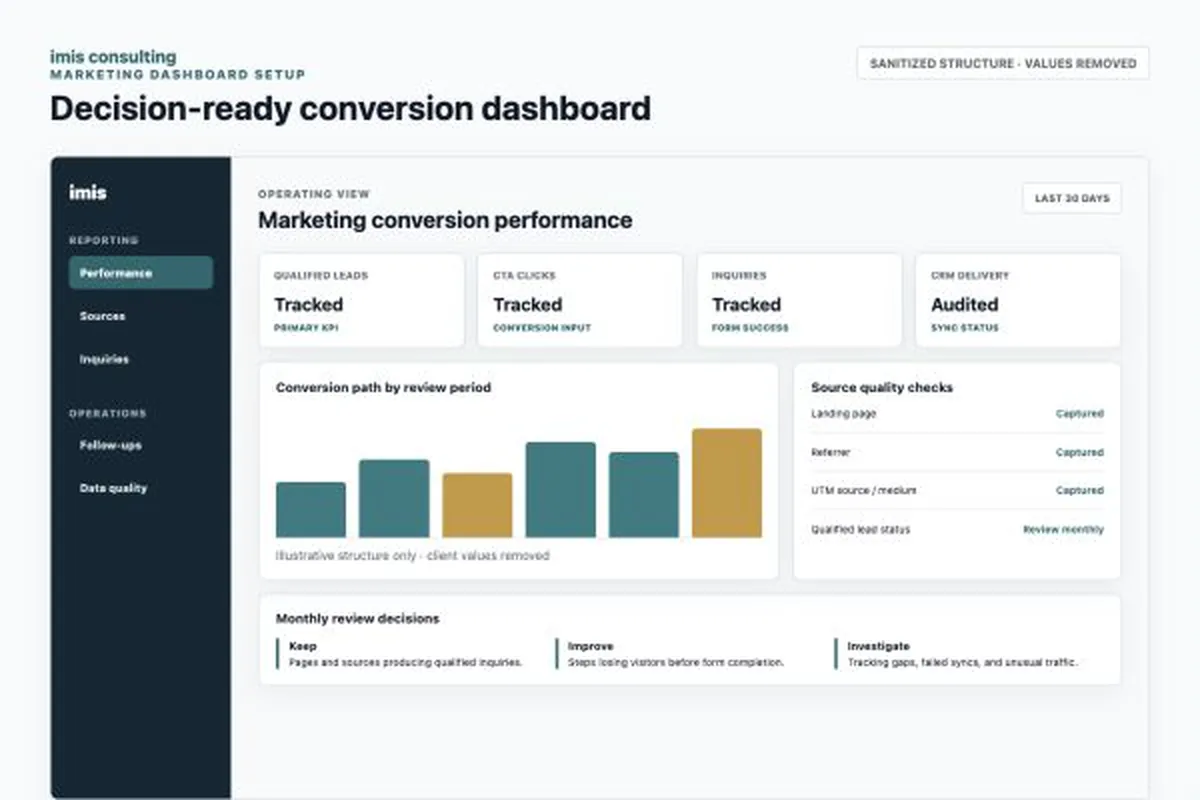
I build the dashboard where your team already works: the views, their links to the sources connected above, and a scheduled refresh where your tool and licensing support one. A Power BI marketing dashboard makes sense when spend, web and pipeline data must be modeled together; a HubSpot dashboard is often enough when the CRM holds most of the story.
For an example of the modeling side of this work, the ceramic 3D printing market forecast case study covers about 140,000 records analyzed and 21 economic and forecasting models built in Excel and Tableau. That project was market analysis, not reporting automation.
| Tool | Good fit when | Watch for |
|---|---|---|
| HubSpot | Most numbers already live in HubSpot and the audience is marketing and sales | Custom reports depend on your subscription tier; data from tools not connected to HubSpot has to be brought in |
| Power BI | You work in Microsoft 365 or need ad, GA4, CRM and finance data in one model | Needs a maintained data model; sharing and scheduled refresh depend on licensing |
| Tableau | Your team already uses Tableau or explores large datasets | Viewer licenses add cost; same modeling work as Power BI |
| Excel | The report is small, people want a file, or there is no BI budget yet | Needs refreshable connections such as Power Query, or it drifts back to copy-paste |
A monthly campaign scorecard
The dashboard is for looking things up; the scorecard is for deciding. One page per month shows each campaign's primary KPI against target, two supporting metrics, and a keep, change or stop call. It follows how to measure and analyze campaign performance, so the numbers and the review share one set of rules.
CRM reporting: getting reliable numbers out of HubSpot or Salesforce
CRM reporting is only as reliable as the fields behind it. If HubSpot or Salesforce can answer the question, I build the report there; if it also needs ad spend and GA4, the CRM becomes one dashboard source.
Either way, I run five checks first and fix or flag what fails. If HubSpot itself needs setting up or cleaning, that is HubSpot implementation work; on any CRM, you can audit your CRM data first.
- Source is captured automatically on every new contact
- Campaign and UTM values land in CRM fields, so a deal traces back to its campaign
- Lifecycle stages have written entry rules; see how to define MQLs and SQLs
- Stage dates are recorded, so you can report how long leads take to move
- Duplicates are merged under a clear rule for which record wins
Process
How it works
Step 1
Agree on the numbers
We start from the decisions the report has to support and fill in the KPI definition sheet together before any source is connected.
Step 2
Automate the data flow
I connect the sources and build the dashboard to refresh on a schedule, with an alert if a refresh fails.
Step 3
Set the review rhythm
We set who reviews the scorecard, on which day each month, and who acts on the result, so the review happens without anyone chasing it.
What you receive
An outcome your team can actually use.
A documented reporting system your business owns: every number has a written definition and one source, data moves on a schedule instead of by export, and your team can run it after handover.
After the reporting review, I send a written scope: sources to connect, KPIs to define, where the dashboard lives, and what it will answer.
Scope boundaries
What this does not include.
Clear exclusions protect the timeline and make a useful follow-on recommendation possible when the evidence supports one.
- A promise of perfect or real-time attribution
- Connectors that have not passed a technical review
- Replacing every operational report
- Tracking vanity metrics that do not support a decision
Questions
Questions before you start
Next step
Start with the one report that takes longest.
Bring it to a 20-minute call, and I'll show you which parts can update themselves and which still need a person's judgment.
Book a 20-minute reporting review